Unlocking Data Insights Securely with Evolytix
Many business professionals can handle basic data analysis in Excel, such as calculating averages, sums, and standard deviations using formulas. However, setting up more complex analyses can be time-consuming. While tools like ChatGPT provide quick solutions, data security remains a concern when sensitive information is involved.
Imagine harnessing the power of generative AI for data analysis while maintaining robust data security. Evolytix offers this comprehensive solution. Leveraging advanced natural language processing (NLP), Evolytix enables users to analyze data effortlessly through simple language commands. Instead of manually inputting data or crafting intricate formulas, users can request the Evolytix Dashboard to generate reports based on specific criteria or questions. This innovative approach optimizes data analysis while prioritizing the protection of sensitive information.
Employing an NLP interface allows a broader range of users to perform data analysis, promoting data democratization within organizations. With Evolytix, users can engage in natural conversations with their data, facilitating a more intuitive and inclusive approach to data analysis. Additionally, the resulting analysis can be seamlessly added to a chart.
Comparison – Evolytix vs. Excel
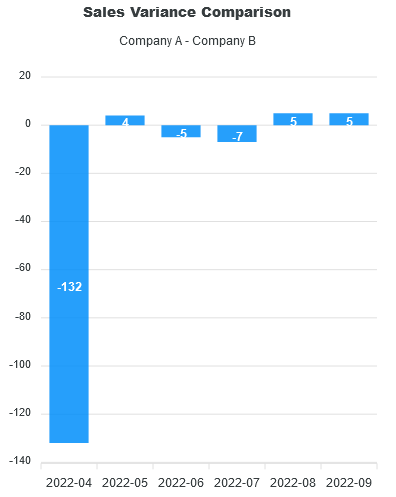
To illustrate the capabilities of Evolytix, let’s compare it with Excel for a more complex analysis scenario. Imagine you have daily sales data for two companies, Company A and Company B. The objective is to compare their average monthly sales and display the variance in a new column.
Using Excel:
- Organize your data: Ensure your data is in columns with dates in one column and values in another.
- Convert dates to months: Use the
MONTH()function. - Calculate monthly averages: Use
AVERAGEIFS(). - Calculate variance: Subtract the monthly average from the daily value.
- Summarize the variances.
Using Evolytix:
- Organize your data in columns with dates and values.
- Upload your CSV file to the Evolytix Dashboard.
- Start a conversation with your data: In the AI Data Builder, type “Compare the average monthly sales between Company A and Company B and display the variance in a new column.”
- View query results.
- Generate a chart or dashboard using the integrated Chart Builder.
Evolytix Screenshots
Starting the conversation with your data using Evolytix

AI Generated Response

Query Results in Tabular Form

AI Generated SQL
SELECT YEAR(Date) AS Year, MONTH(Date) AS Month, AVG(Company_A_Sales) AS Avg_Company_A_Sales, AVG(Company_B_Sales) AS Avg_Company_B_Sales, AVG(Company_A_Sales) – AVG(Company_B_Sales) AS Sales_Variance FROM Comparison_Sample_93 GROUP BY YEAR(Date), MONTH(Date) ORDER BY YEAR(Date), MONTH(Date)
Chart Via Evolytix Integrated Chart Builder

Privacy-Centric Design: Commitment to User Security
Evolytix emphasizes user privacy. By restricting the AI’s role to interpretation rather than data processing, the platform ensures sensitive information is never accessed or processed by the AI model. This approach adheres to stringent data privacy standards, fostering user trust. The Evolytix platform stands as a pioneer in secure data reporting, delivering powerful insights with a privacy-first approach.
Conclusion
In terms of report creation speed, Evolytix’s NLP capabilities give it a clear edge over Excel. The ability to generate reports with simple language commands eliminates manual tasks and complex formulas, leading to faster and more efficient reporting.
However, Excel remains a formidable tool for those familiar with its functionalities. Choosing between Evolytix and Excel depends on your specific needs, preferences, and expertise level. If speed and simplicity are priorities, Evolytix is the better choice. For advanced data analysis, Excel remains reliable.


